Sometimes when you conduct (or read) a study you learn you’re wrong in interesting ways. Other times, maybe you’re wrong for less interesting reasons.
Being wrong about the “first stage” can be an example of the latter. Maybe you thought you had a neat natural experiment. Or you tried a randomized encouragement to an endogenous behavior of interest, but things didn’t go as you expected. I think there are some simple, uncontroversial cases here of being wrong in uninteresting ways, but also some trickier ones.
Not enough compliers
Perhaps the standard way to be wrong about the first stage is to think there is one when there more or less isn’t — when the thing that’s supposed to produce some random or as-good-as-random variation in a “treatment” (considered broadly) doesn’t actually do much of that.
Here’s an example from my own work. Some collaborators and I were interested in how setting fitness goals might affect physical activity and perhaps interact with other factors (e.g., social influence). We were working with a fitness tracker app, and we ran a randomized experiment where we sent new notifications to randomly assigned existing users’ phones encouraging them to set a goal. If you tapped the notification, it would take you to the flow for creating a goal.
One problem: Not many people interacted with the notifications and so there weren’t many “compliers” — people who created a goal when they wouldn’t have otherwise. So we were going to have a hopelessly weak first stage. (Note that this wasn’t necessarily weak in the sense of the “weak instruments” literature, which is generally concerned about a high-variance first stage producing bias and resulting inference problems. Rather, even if we knew exactly who the compliers were — compliers are a latent stratum, it was a small enough set of people that we’d have very low power for any of the plausible second-stage effects.)
So we dropped this project direction. Maybe there would have been a better way to encourage people to set goals, but we didn’t readily have one. Now this “file drawer” might mislead people about how much you can get people to act on push notifications, or the total effect of push notifications on our planned outcomes (e.g., fitness activities logged). But it isn’t really so misleading about the effect of goal setting on our planned outcomes. We just quit because we’d been wrong about the first stage — which, to a large extent, was a nuisance parameter here, and perhaps of interests to a smaller (or at least different, less academic) set of people.
We were wrong in a not-super-interesting way. Here’s another example from James Druckman:
A collaborator and I hoped to causally assess whether animus toward the other party affects issue opinions; we sought to do so by manipulating participants’ levels of contempt for the other party (e.g., making Democrats dislike Republicans more) to see if increased contempt led partisans to follow party cues more on issues. We piloted nine treatments we thought could prime out-party animus and every one failed (perhaps due to a ceiling effect). We concluded an experiment would not work for this test and instead kept searching for other possibilities…
Similarly, here the idea is that the randomized treatments weren’t themselves of primary interest, but were necessary for the experiment to be informative.
Now, I should note that, at least with a single instrument and a single endogenous variable, pre-testing for instrument strength in the same sample that would be used for estimation introduces bias. But it is also hard to imagine how empirical researchers are supposed to allocate their efforts if they don’t give up when there’s really not much of a first stage. (And some of these cases here are cases where the pre-testing is happening on a separate pilot sample. And, again, the relevant pre-testing here is not necessarily a test for bias due to “weak instruments”.)
Forecasting reduced form results vs. effect ratios
This summer I tried to forecast the results of the newly published randomized experiments conducted on Facebook and Instagram during the 2020 elections. One of these interventions, which I’ll focus on here, replaced the status quo ranking of content in users’ feeds with chronological ranking. I stated my forecasts for a kind of “reduced form” or intent-to-treat analysis. For example, I guessed what the effect of this ranking change would be on a survey measure of news knowledge. I said the effect would be to reduce Facebook respondents’ news knowledge by 0.02 standard deviations. The experiment ended up yielding a 95% CI of [-0.061, -0.008] SDs. Good for me.
On the other hand, I also predicted that dropping the optimized feed for a chronological one would substantially reduce Facebook use. I guessed it would reduce time spent by 8%. Here I was wrong, the reduction was more than double that, with what I roughly calculate to be a [-23%, -19%] CI.
OK, so you win some you lose some, right? I could even self-servingly say, hey, the more important questions here were about news knowledge, polarization etc., not exactly how much time people spend on Facebook.
It is a bit more complex than that because these two predictions were linked in my head: one was a kind of “first stage” for the other, and it was the first stage I got wrong.
Part of how I made that prediction for news knowledge was by reasoning that we have some existing evidence that using Facebook increases people’s news knowledge. For example, Allcott, Braghieri, Eichmeyer & Gentzkow (2020) paid people to deactivate Facebook for four weeks before the 2018 midterms. They estimate a somewhat noisy local average treatment effect of -0.12 SDs (SE: 0.05) on news knowledge. Then I figured my predicted 8% reduction probably especially “consumption” time (rather than time posting and interacting around one’s own posts), would translate into a much smaller 0.02 SD effect. I made some various informal adjustments, such as a bit of “Bayesian-ish” shrinkage towards zero.
So while maybe I got the ITT right, perhaps this is partially because I seemingly got something else wrong: the effect ratio of news knowledge over time spent (some people might call this an elasticity or semi-elasticity). Now I think it turns out here that the CI for news knowledge is pretty wide (especially if one adjusts for multiple comparisons), so even if, given the “first stage” effect, I should have predicted an effect over twice as large, the CI includes that too.
Effect ratios, without all the IV assumptions
Over a decade ago, Andrew wrote about “how to think about instrumental variables when you get confused”. I think there is some wisdom here. One of the key ideas is to focus on the first stage (FS) and what sometimes is called the reduced form or the ITT: the regression of the outcome on the instrument. This sidelines the ratio of the two, ITT/FS — the ratio that is the most basic IV estimator (i.e. the Wald estimator).
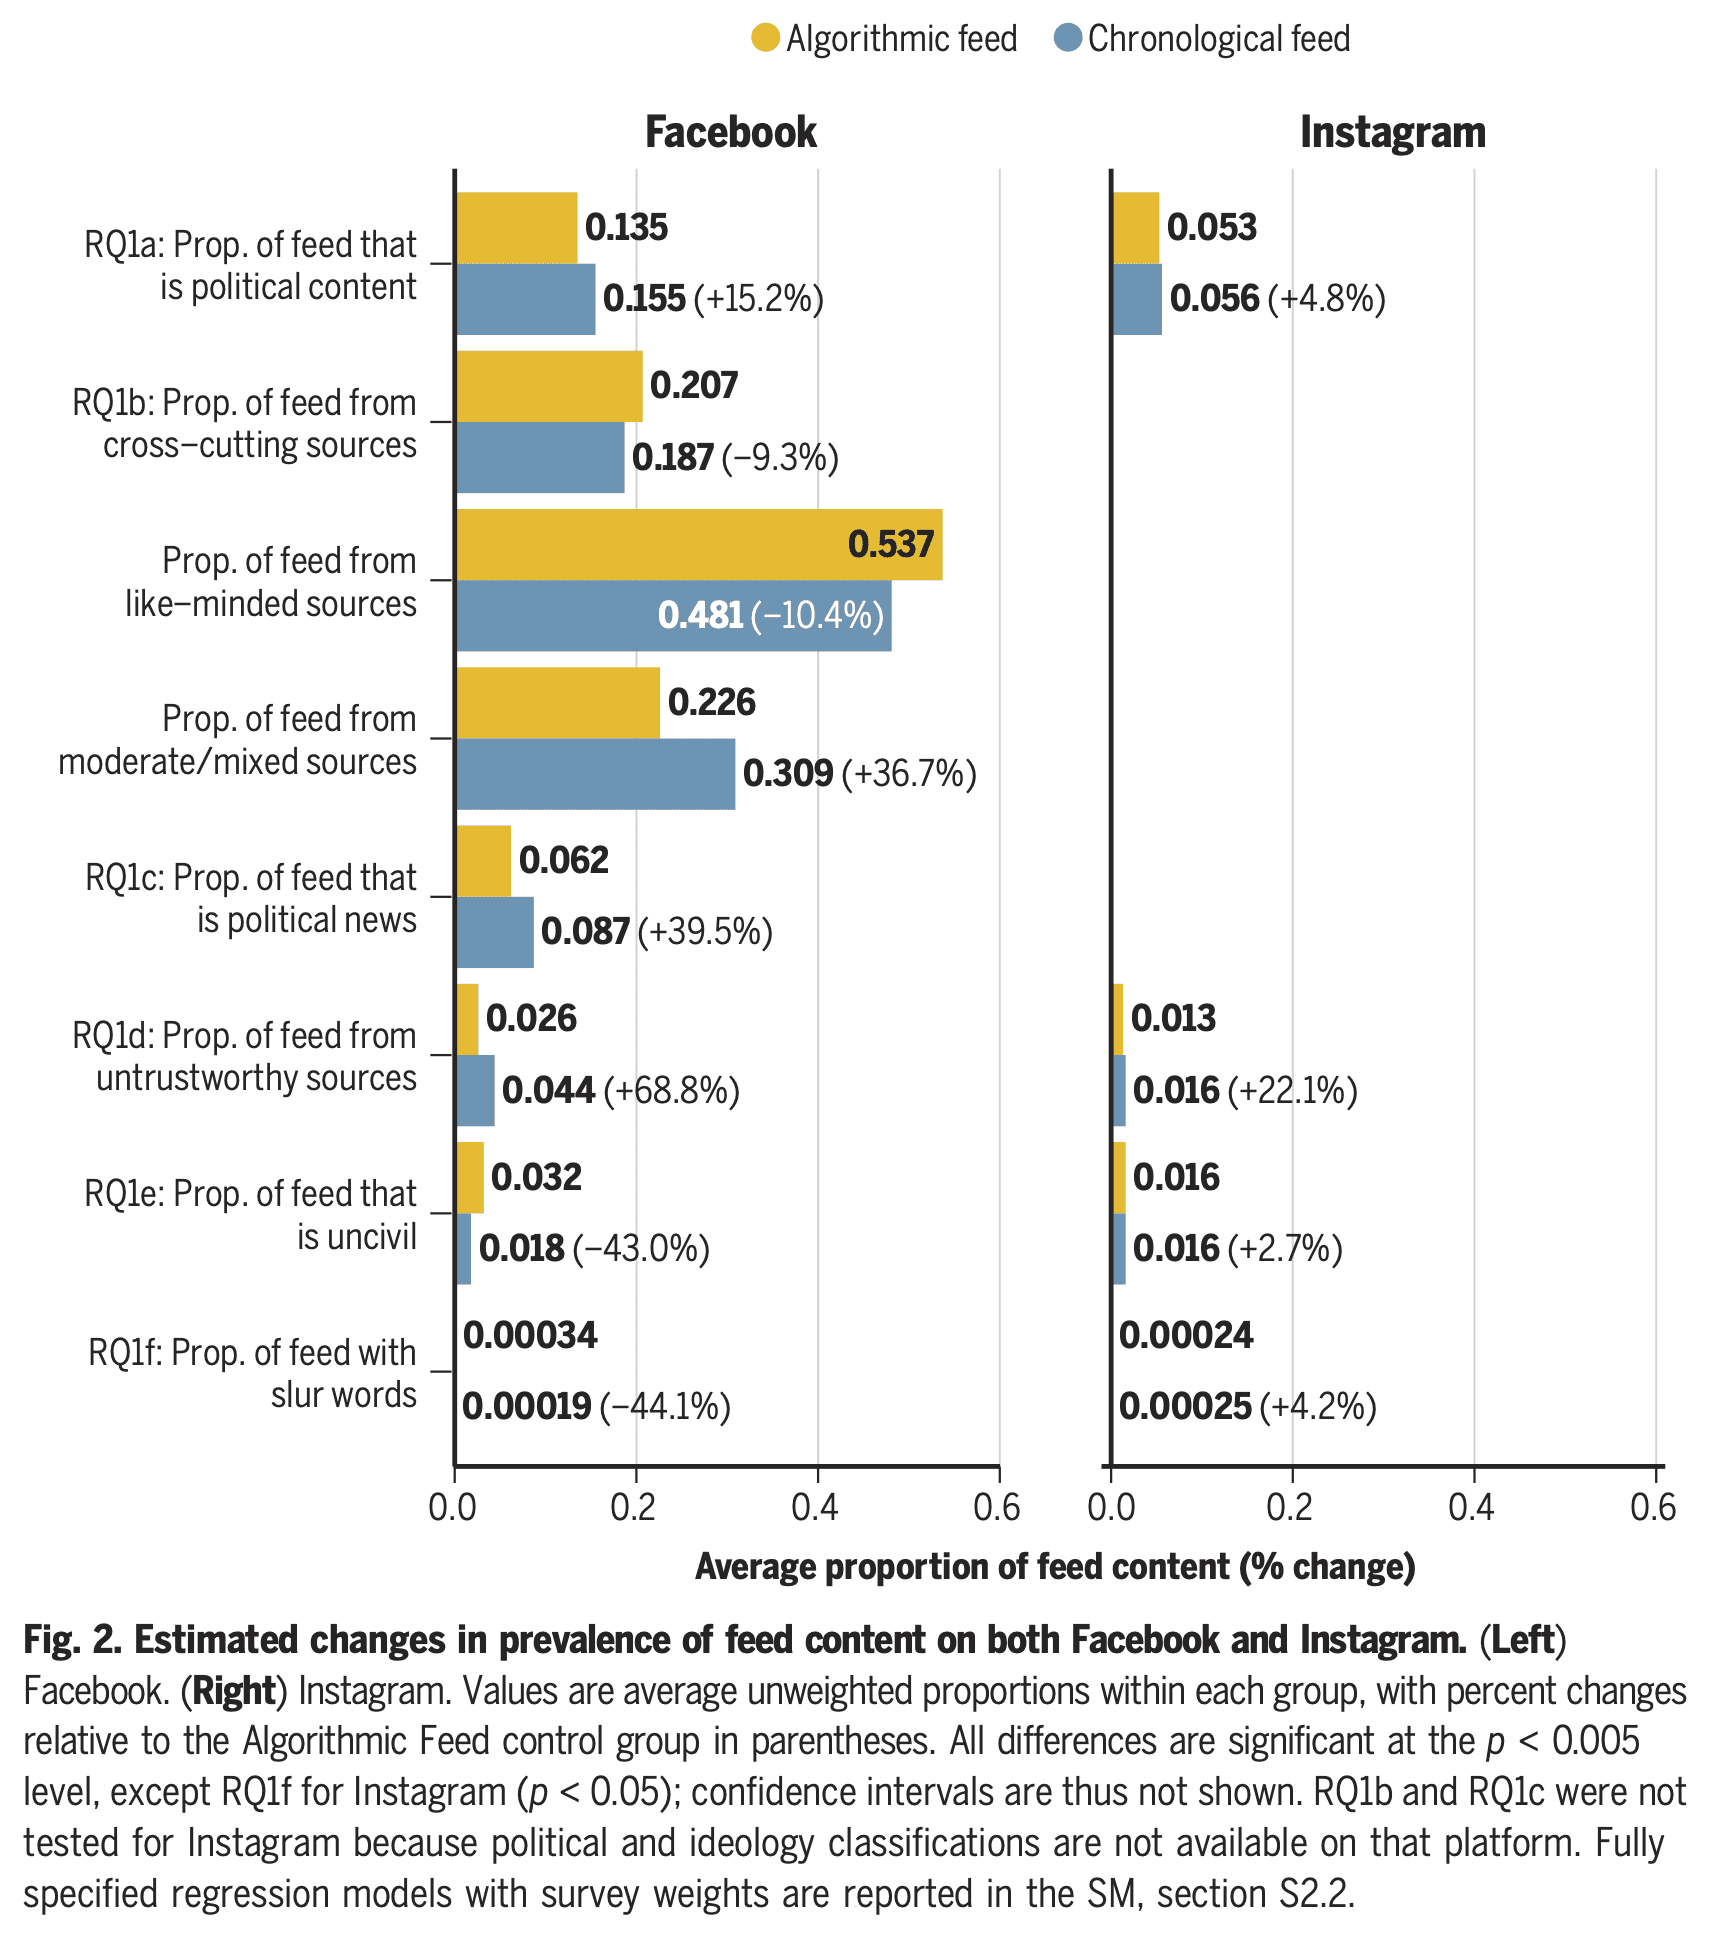
So why am I suggesting thinking about the effect ratio, aka the IV estimand? And I’m suggesting thinking about it in a setting where the exclusion restriction (i.e. complete mediation, whereby the randomized intervention only affects the outcome via the endogenous variable) is pretty implausible. In the example above, it is implausible that the only affect of changing feed ranking is to reduce time spent on Facebook, as if that was a homogenous bundle. Other results show that the switch to a chronological feed increased, for example, the fraction of subjects’ feeds that was political content, political news, and untrustworthy sources:
Without those assumptions, this ratio can’t be interpreted as the effect of the endogenous exposure (assuming homogeneous effects) or a local average treatment effect. It’s just a ratio of two different effects of the random assignment. Sometimes in the causal inference literature there is discussion of this more agnostic parameter, labeled an “effect ratio” as I have done.
Does it make sense to focus on the effect ratio even when the exclusion restriction isn’t true?
Well in the case above, perhaps it makes sense because I used something like this ratio to produce my predictions. (But maybe this was or was not a sensible way to make predictions.)
Second, even if the exclusion restriction isn’t true, it can be that the effect ratio is more stable across the relevant interventions. It might be that the types of interventions being tried work via two intermediate exposures (A and B). If the interventions often affect them to somewhat similar degrees (perhaps we think about the differences among interventions being described by a first principal component that is approximately “strength”), then the ratio of the effect on the outcome and the effect on A can still be much more stable across interventions than the total effect on Y (which should vary a lot with that first principal component). A related idea is explored in the work on invariant prediction and anchor regression by Peter Bühlmann, Nicolai Meinshausen, Jonas Peters, and Dominik Rothenhäusler. That work encourages us to think about the goal of predicting outcomes under interventions somewhat like those we already have data on. This can be a reason to look at these effect ratios, even when we don’t believe we have complete mediation.
[This post is by Dean Eckles. Because this post touches on research on social media, I want to note that I have previously worked for Facebook and Twitter and received funding for research on COVID-19 and misinformation from Facebook/Meta. See my full disclosures here.]